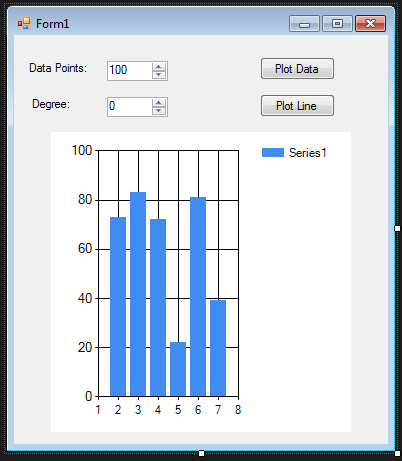
The skeletal structure of this application is the figure below:-
The application in action looks like this:-
This application is powered my the Math.Net Numerics library. The code typed-in during the ML tutorial is as follows:-
using System;
using System.Collections.Generic;
using System.ComponentModel;
using System.Data;
using System.Diagnostics;
using System.Drawing;
using System.IO;
using System.Linq;
using System.Text;
using System.Text.RegularExpressions;
using System.Threading.Tasks;
using System.Windows.Forms;
using Microsoft.Office.Interop.Excel;
using ExcelApp = Microsoft.Office.Interop.Excel;
using MathNet.Numerics.LinearAlgebra.Double;
namespace Tutorials
{
public partial class Form1 : Form
{
public Form1()
{
InitializeComponent();
}
Random rand = new Random();
double[] xCoords;
double[] yCoords;
private void button1_Click(object sender, EventArgs e)
{
xCoords = new double[Convert.ToInt32(numericUpDown1.Value)];
yCoords = new double[Convert.ToInt32(numericUpDown1.Value)];
chart1.Titles.Clear();
chart1.Series.Clear();
chart1.Titles.Add("Linear Regression");
for (var i = 0; i < Math.Floor(xCoords.GetLength(0) / 2.0); i++)
xCoords[i] = rand.Next(i - xCoords.Length / 10, i + xCoords.Length / 10);
for (var i = Convert.ToInt32(Math.Floor(xCoords.GetLength(0) / 2.0)); i < xCoords.GetLength((0)); i++)
xCoords[i] = rand.Next(i + xCoords.Length / 5, i + xCoords.Length / 2);
for (var i = 0; i < Math.Floor(yCoords.GetLength(0) / 2.0); i++)
yCoords[i] = rand.Next(i, i + yCoords.Length / 5);
for (var i = Convert.ToInt32(Math.Floor(yCoords.GetLength(0) / 2.0)); i < yCoords.GetLength((0)); i++)
yCoords[i] = rand.Next(i - yCoords.Length / 10, i);
chart1.Series.Add("Data Points");
chart1.Series["Data Points"].ChartType = System.Windows.Forms.DataVisualization.Charting.SeriesChartType.Point;
for (var i = 0; i < xCoords.Length; i++)
chart1.Series["Data Points"].Points.AddXY(xCoords[i], yCoords[i]);
chart1.Series["Data Points"].Color = Color.DarkOrange;
chart1.Series.Add("QR Line");
chart1.Series["QR Line"].ChartType = System.Windows.Forms.DataVisualization.Charting.SeriesChartType.Line;
chart1.Series["QR Line"].Color = Color.DarkGreen;
chart1.Series.Add("Calc Line");
chart1.Series["Calc Line"].ChartType = System.Windows.Forms.DataVisualization.Charting.SeriesChartType.Line;
chart1.Series["Calc Line"].Color = Color.DarkRed;
}
private void button2_Click(object sender, EventArgs e)
{
chart1.Series["QR Line"].Points.Clear();
chart1.Series["Calc Line"].Points.Clear();
var degree = Convert.ToInt32(numericUpDown2.Value);
var X = new DenseMatrix(xCoords.Length, degree + 1);
X.SetColumn(0, DenseVector.Create(xCoords.Length, i => 1));
if (degree != 0)
X.SetColumn(1, xCoords);
for (int i = 2; i <= degree; i++)
X.SetColumn(i, X.Column(1).PointwiseMultiply(X.Column(i - 1)));
var y = DenseMatrix.OfColumns(yCoords.Length, 1, new[] { new DenseVector(yCoords) });
var qrTheta = X.QR().Solve(y).ToColumnWiseArray();
//(XTX)-1 * (XTy).
var calcTheta = (X.Transpose().Multiply(X)).Inverse()
.Multiply(X.Transpose()).Multiply(y).ToColumnWiseArray();
var xMax = xCoords.Max();
var xMin = xCoords.Min();
var interval = (xMax - xMin) / Convert.ToDouble(numericUpDown1.Value);
for (var i = xMin; i < xMax; i += interval)
{
chart1.Series["QR Line"].Points.AddXY(i, yPrediction(i, qrTheta));
chart1.Series["Calc Line"].Points.AddXY(i, yPrediction(i, calcTheta));
}
}
private static double yPrediction(double xPlot, double[] theta)
{
var yPlot = 0.0;
for (var i = 0; i < theta.Length; i++)
yPlot += theta[i] * Math.Pow(xPlot, i);
return yPlot;
}
}
}
Thank you for reading this post and watching the videos. Please Subscribe, Comment and Rate the Channel if you liked the videos.
Goto C# Experiments to access more of such content! Thanks again!


No comments:
Post a Comment